
Compressed air is often called the fourth utility in a factory, alongside electricity, water and gas, and it is by far the most expensive one to produce. Yet many plants run for years without knowing what a cubic metre of air actually costs, because the bill arrives blended into a single monthly electricity invoice. Decisions then get made on purchase price alone, and the machine that looked cheapest on the quotation quietly becomes the most expensive asset in the compressor room.
Air compressor electricity cost is calculated by multiplying the total package input power in kW by the annual running hours, the share of time spent at each load state, the fraction of full power drawn in that state, and the local electricity price per kWh, then adding the results for every load state. That gives annual kilowatt-hours, which convert to cost with one multiplication. Dividing the cost by the volume of air actually delivered gives the cost per cubic metre or per 1,000 cubic feet, the only figure that can be compared fairly across machines, pressures and sites.
The sections below work through each variable in turn, from reading a motor nameplate to benchmarking one machine against another.
Why Electricity, Not the Purchase Price, Decides the Real Cost
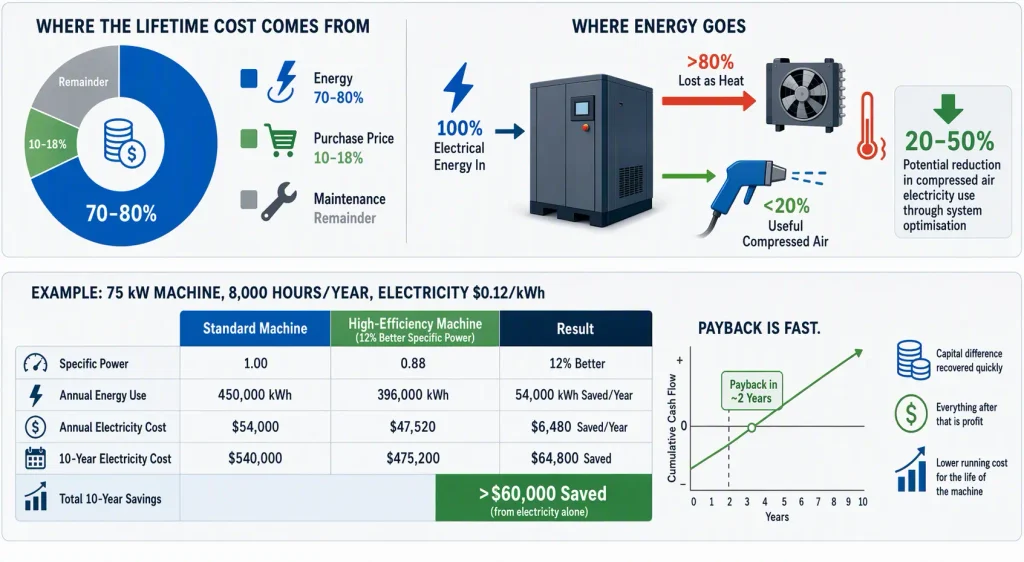
Energy typically accounts for 70 to 80 percent of the lifetime cost of an industrial air compressor, while the purchase price accounts for roughly 10 to 18 percent and maintenance for the remainder. A price gap of 20 percent between two machines of the same size is trivial next to a 15 percent gap in specific power sustained across 60,000 running hours.
The reason is thermodynamic. Compression converts electrical energy into pressure and heat, and most of that heat leaves through the cooler rather than reaching the point of use. According to the U.S. Department of Energy, more than 80 percent of the energy entering a compressed air system is lost before it performs useful work, and systems-level optimisation typically cuts a plant’s compressed air electricity consumption by 20 to 50 percent.
That ratio reframes the purchasing decision. A 75 kW machine running 8,000 hours a year consumes about 450,000 kWh, roughly 54,000 a year at 0.12 per kWh. Bought at a 25 percent premium but with 12 percent better specific power, it saves over 60,000 across a ten-year life. Capital differences are settled in the first two years; everything after that is a running-cost decision.
| Cost element | Share of 10-year total | Behaviour over time |
| Capital purchase | 10 to 18 percent | Fixed at commissioning |
| Electricity | 70 to 80 percent | Recurs every operating hour |
| Maintenance and parts | 8 to 12 percent | Rises with hours and air quality |
The Core Formula for Air Compressor Electricity Cost
Annual electricity cost equals the sum, across every load state, of package input kW multiplied by the hours spent in that state, the fraction of full power drawn in that state, and the tariff per kWh. Four inputs are enough: package kW, annual running hours, load profile, and electricity rate.
Written out in plain terms:
Annual energy cost = (kW at full load x hours at full load x 1.0) + (kW at part load x hours at part load x power fraction) + (kW unloaded x hours unloaded x power fraction), all multiplied by the rate per kWh.
Defining Each Variable
Most errors come from misreading an input rather than from arithmetic.
- Package input kW. Total electrical input to the whole package at a stated discharge pressure, including motor, cooling fan, oil pump and drive losses. Not the motor nameplate rating, and not airend shaft power.
- Annual running hours. Hours the machine is energised. Unloaded and idle hours count, because an unloaded rotary screw still draws 20 to 35 percent of full-load power.
- Load profile. The share of running time at full load, at intermediate loads, and unloaded.
- Power fraction. The part-load power drawn in each state. On load and unload control this is roughly 1.0 when loaded and 0.2 to 0.35 when unloaded; on variable speed control it follows the part-load curve.
- Tariff. Cost per kWh, ideally including demand charges and any time-of-use structure, since compressors often run through peak windows.
Calculating by Load State Instead of by Average
Averaging load across the year is the most common shortcut and the most common error, because power does not fall in proportion to output. A machine at 50 percent average demand may spend half its time fully loaded and half unloaded, and unloaded running draws a large share of full power while delivering no air at all.
Consider a 160 kW package running 6,800 hours a year, loaded 85 percent of the time and unloaded for the remainder at 25 percent of full power.
| Load state | Hours per year | Power drawn | Energy consumed |
| Full load | 5,780 | 160 kW | 924,800 kWh |
| Unloaded | 1,020 | 40 kW | 40,800 kWh |
| Total | 6,800 | 104.4 kW average | 965,600 kWh |
At 0.12 per kWh the annual cost is 115,872, and the 1,020 unloaded hours account for 4,896 of it while producing nothing. On a plant with weak shutdown discipline that line item can double, which is why it is usually the first place an energy audit looks.
How to Calculate Compressor kW from Motor Data
Three methods exist, in descending order of reliability: take the package input kW from a verified performance data sheet, measure it with a power analyser under real load, or calculate it from motor nameplate data. The nameplate route is the least accurate, because it describes motor output rather than package input and ignores efficiency, power factor and auxiliary loads.
From the Nameplate: Volts, Amps and Power Factor
For a three-phase motor, input power is voltage multiplied by current, by the square root of three, by the power factor, divided by 1,000.
kW = (volts x amps x power factor x 1.732) / 1,000
A 400 V motor drawing 145 A at a power factor of 0.88 therefore consumes 400 x 145 x 0.88 x 1.732 / 1,000 = 88.4 kW. Power factor is the ratio of real power doing work to apparent power supplied, and it matters because a lightly loaded motor has a poor power factor, so a naive volts-times-amps figure overstates consumption. Note also that full load amps on a nameplate is a maximum service rating, not operating current; the calculation needs a value measured under representative load.
From Horsepower: The 0.746 Factor and Motor Efficiency
Shaft power in kW is horsepower multiplied by 0.746. Electrical input is shaft power divided by motor efficiency, which for modern IE3 and IE4 machines sits between 91 and 96 percent depending on size.
| Motor rating | Shaft kW at 0.746 factor | Typical efficiency | Input kW |
| 10 HP | 7.5 | 90 percent | 8.3 |
| 30 HP | 22.4 | 93 percent | 24.1 |
| 75 HP | 55.9 | 94.5 percent | 59.2 |
| 150 HP | 111.9 | 95.5 percent | 117.2 |
| 200 HP | 149.2 | 96 percent | 155.4 |
Converting between kW, HP, CFM and cubic metres per minute catches people out repeatedly, particularly when a quotation in horsepower is compared against a data sheet in kW, so air compressor unit conversions are worth doing deliberately rather than by memory.
Why Package kW Is Higher Than Motor kW
The motor is not the only load in the enclosure. Cooling fans, the oil pump, drive electronics and transmission losses all draw power the meter records, so package input power runs 3 to 8 percent above motor input power, widening on air-cooled machines in hot ambient conditions. Using motor kW as a proxy understates cost slightly, which is immaterial in one calculation but not in a ten-year model. Use package specific power from a data sheet tested to ISO 1217 reference conditions instead.
How to Calculate CFM per kW and Specific Power
At 7 bar, roughly 100 psig, a well-designed industrial compressor delivers about 5 CFM per kW of input power, which is the same statement as 1 kW producing 5 CFM. The classic derivation starts from 4 CFM per motor horsepower, divided by the 0.81 kW that one horsepower actually draws at the wall once efficiency is included, giving 4.9 CFM per kW. Modern machines reach 5.5 to 6.0 CFM per kW at the same pressure, so treat the round figure as a sanity check rather than a specification.
The CFM per kW Method
The relationship is delivered flow divided by package input power: CFM per kW = CFM delivered / package input kW. A 160 kW package delivering 955 CFM at 7 bar gives 5.97 CFM per kW, and the reciprocal is 0.168 kW per CFM. Because flow and power both scale with discharge pressure, the ratio is only meaningful when both numbers refer to the same pressure; a machine rated at 7 bar will always look better than an identical machine rated at 10 bar.
Specific Power: The Number That Actually Compares Machines
Specific power normalises the same relationship to a common base so machines of different sizes can be ranked.
kW per 100 CFM = (package kW x 100) / CFM delivered
kWh per cubic metre = package kW / (cubic metres per minute x 60)
| Machine class at 7 bar | Specific power, kW per 100 CFM | CFM per kW |
| Centrifugal at design point | about 16 | about 6.3 |
| Modern oil-injected screw, variable speed | about 18 | about 5.5 |
| Small reciprocating | 19.8 to 22.7 | 4.4 to 5.1 |
| Older fixed-speed screw at part load | 25.5 to 34.0 | 2.9 to 3.9 |
The final row explains why so many plants find 30 to 40 percent of avoidable cost in a compressor room that appears to be working normally. The machines are not faulty; they are oversized and running at part load on load and unload control.
Figures like these are only trustworthy when they come from a standardised test. The Compressed Air and Gas Institute runs a third-party verification programme in which randomly selected rotary compressors are tested by an independent laboratory against their published data sheets, which report package specific power alongside full-load capacity. A quotation without a verifiable specific power figure cannot be compared with one that has it, and comparing at different rated pressures invalidates the comparison entirely. Reading a full air compressor CFM chart alongside specific power gives a quick cross-check that a proposed machine is sized and rated sensibly.
How Much Electricity Does an Air Compressor Use?
A small portable compressor draws under 1 kW, a workshop machine 1.5 to 7.5 kW, an industrial rotary screw 22 to 250 kW, and a large centrifugal unit from several hundred to several thousand kW. Annual consumption is the figure that matters, and at 75 percent average load it comes to roughly 6,000 times the rated kW for continuous operation.
| Rated kW | Typical application | kWh at 4,000 hours | kWh at 8,000 hours |
| 2.2 | Portable and small workshop use | 6,600 | 13,200 |
| 7.5 | Single workshop, hand tools | 22,500 | 45,000 |
| 22 | Small production line | 66,000 | 132,000 |
| 55 | Multi-point factory air | 165,000 | 330,000 |
| 75 | Medium plant, continuous duty | 225,000 | 450,000 |
| 160 | Heavy continuous process air | 480,000 | 960,000 |
| 250 | Plant-wide supply, multiple users | 750,000 | 1,500,000 |
The same physics scales across every size class, so air compressor power consumption follows one rule whether the machine is a 2.2 kW portable unit or a 250 kW plant compressor: power drawn is set by pressure and flow, and cost is set by hours.
Converting kWh into Cost per Unit of Air
Divide annual electricity cost by the volume of air actually delivered in the same period. A modern 160 kW machine at 7 bar consumes about 0.10 kWh per cubic metre of air, which at 0.12 per kWh works out to roughly 0.012 per cubic metre, or about 20 per 1,000 CFM per hour.
| Specific power | At 0.08 per kWh | At 0.12 per kWh | At 0.18 per kWh |
| 17 kW per 100 CFM | 13.60 | 20.40 | 30.60 |
| 20 kW per 100 CFM | 16.00 | 24.00 | 36.00 |
| 25 kW per 100 CFM | 20.00 | 30.00 | 45.00 |
| 30 kW per 100 CFM | 24.00 | 36.00 | 54.00 |
Cost per 1,000 CFM per hour, at three electricity rates.
This is the only unit of cost that survives comparison across machine sizes, pressures and tariffs, which is why it is used for internal charging between departments, for product costing, and for justifying or rejecting a replacement. It also exposes the pressure penalty directly: raising discharge pressure by 1 bar increases power by roughly 6 to 8 percent while delivering almost no additional air, so cost per unit of air rises by the same proportion.
What Pushes Air Compressor Electricity Cost Up
Seven factors account for most of the avoidable cost in a typical compressor room: a discharge pressure set higher than production needs, leakage, part-load operation, pressure drop through treatment equipment and piping, clogged filters and fouled coolers, high intake air temperature, and deferred maintenance. Several cost nothing but attention to correct.
| Factor | Impact on consumption | Recoverable saving |
| Discharge pressure 1 bar above requirement | 6 to 8 percent more power | 6 to 8 percent |
| Leakage at 20 to 30 percent of output | Wasted generating capacity | 10 to 20 percent |
| Part load on load and unload control | Unloaded hours at 20 to 35 percent power | 10 to 25 percent |
| Pressure drop of 1 bar across dryers and filters | Compensated by raising setpoint | 5 to 7 percent |
| Clogged intake filter | 1 to 3 percent more power | 1 to 3 percent |
| Intake air 10 degrees C above design | Lower mass flow per unit of power | 2 to 3 percent |
| Deferred maintenance, fouled cooler | Rising discharge temperature and pressure loss | 3 to 8 percent |
Leakage deserves particular attention because it is invisible and permanent. A single 3 mm hole can pass enough air on a continuously running system to waste tens of thousands of kilowatt-hours a year, and it flows through nights and weekends whether or not production is running. Leak surveys usually find that the largest ten leaks account for the majority of the loss, which is why a targeted programme beats a general repair sweep.
How to Reduce Air Compressor Electricity Cost
Start with measures that require no capital: lower the pressure setpoint to the minimum production genuinely needs, repair leaks, replace clogged filters and stop the machine when the line stops. These typically recover 10 to 20 percent of consumption within a few months. Capital measures such as variable speed control, two-stage compression, heat recovery and central sequencing can add a further 10 to 30 percent.
No-Cost and Low-Cost Measures
- Reduce discharge pressure in steps of 0.2 bar while monitoring production, stopping where the most demanding end use begins to struggle.
- Survey and tag leaks during a shutdown with an ultrasonic detector, repair the largest first, and repeat quarterly.
- Replace intake filters on pressure drop rather than on calendar interval, and clean coolers at the same time.
- Replace timer drains with zero-loss condensate drains, which discharge only when condensate is present instead of venting compressed air every cycle.
- Enforce shutdown at shift end, since unloaded running after production stops is pure waste.
- Verify receiver capacity, because insufficient storage causes short cycling and pressure swings that force a higher setpoint.
Capital Measures That Pay Back
| Measure | Typical saving | Where it applies |
| Variable speed drive | 15 to 35 percent | Demand varying more than 20 percent around the mean |
| Two-stage compression | 8 to 15 percent | Continuous duty above 75 kW at higher pressure |
| Heat recovery | Offsets 50 to 90 percent of heating load | Sites with year-round hot water demand |
| Central sequencing controller | 5 to 15 percent | Two or more compressors in parallel |
| Larger piping, low-drop treatment | 3 to 8 percent | Long runs, undersized headers |
| Right-sizing a replacement | 10 to 30 percent | Oversized or end-of-life equipment |
Matching control strategy to the load profile is where most of the capital saving sits. A fixed-speed machine is efficient at steady full load and wasteful at half demand, while a variable speed machine holds specific power nearly flat across its turndown range but loses that advantage at full output. Choosing between VSD vs fixed-speed compressors on the load profile rather than the quotation is the highest-value decision in most retrofits.
Building a Baseline So the Savings Are Provable
Measure both the electrical side and the air side for at least one full production week before changing anything, then repeat the measurement after each intervention. Without a baseline, savings remain an opinion rather than a number, and unverified savings are the first thing cut from the next budget cycle.
Log interval data for current, voltage, power factor and kWh on the supply side, and pressure, flow and dew point on the air side. Reduce the result to two figures: annual kWh and specific energy consumption in kWh per cubic metre. Tracked monthly and normalised for production volume, those two numbers show within weeks whether a leak programme actually worked.
Frequently Asked Questions
How do I calculate electricity cost for a compressor that runs one shift only?
Use actual hours rather than an annual figure, and account for the pressurised idle period after the shift ends. A single-shift plant running 2,000 production hours may still have the system pressurised for 6,000, which changes both the arithmetic and the case for automatic shutdown. Multiply package kW by each block of hours separately, including nights and weekends, rather than assuming the compressor stops when the line does.
Why is the nameplate kW on a variable speed compressor misleading?
Because it describes power at maximum speed, which the machine may reach for only a fraction of its operating time. What determines the bill is part-load specific power, which appears as a curve rather than a single figure, and two machines with identical maximum ratings can differ by 20 percent at half demand. Ask for the part-load curve at 25, 50, 75 and 100 percent of capacity, and compare at a pressure both machines actually run at.
Is it cheaper to run one large compressor or two smaller ones?
It depends on how far demand falls below combined capacity. Two machines give turndown a single fixed-speed unit cannot match, and allow one to be serviced without stopping production, but installation, maintenance and standby losses roughly double. Below about 40 percent of combined capacity a single correctly sized machine with adequate storage usually costs less to run; above that, sequencing a base-load unit with a smaller trim unit typically wins.